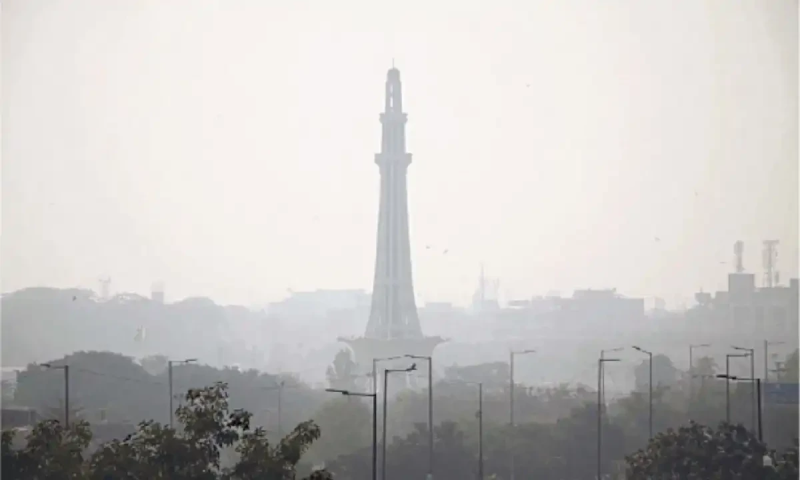
Every morning in Pakistan, the news echoes the same worrying refrain: the air quality is bad again. In cities like Lahore and Karachi, it has almost become routine to hear that the AQI is soaring. Lahore, once called the “City of Gardens,” now often carries a darker title the second most polluted city in the world. One chilly morning, you open your weather app, expecting to see the temperature, but instead, your eyes catch a strange number, 187, glowing beside a coloured bar that fades from yellow to red. That’s when you meet the AQI, the Air Quality Index, a quiet little number that tells a much bigger story: how clean or polluted the air around you really is, and what that means for the breath you just took.
AQI converts pollutant concentrations into a 0–500 scale so anyone can understand air quality at a glance. Higher = Worse.
What the numbers and colours mean?
| AQI Range | Color | Air Quality | What it Means for You |
| 0–50 | Green | Good | Air is clean—enjoy outdoor activities. |
| 51–100 | Yellow | Moderate | OK for most; unusually sensitive people should watch symptoms. |
| 101–150 | Orange | Unhealthy for Sensitive Groups | Children, seniors, and people with heart/lung disease should limit long or intense outdoor exertion. |
| 151–200 | Red | Unhealthy | Everyone may feel effects; sensitive groups more serious. Cut back outdoor activity. |
| 201–300 | Purple | Very Unhealthy | Health alert. Avoid outdoor exertion; move indoors with cleaner air. |
| 301–500 | Maroon | Hazardous | Emergency conditions. Stay indoors with clean air if possible. |
Imagine standing on a rooftop in Lahore, watching the haze blur the city skyline. What’s in that air, really? The answer lies in a handful of invisible culprits that scientists track every single day. First, there are the tiniest troublemakers — PM2.5, fine particles so small they can slip deep into your lungs and even sneak into your bloodstream. Then come PM10, the coarser cousins made of dust, pollen, and mold — big enough to see floating in sunlight, yet small enough to breathe in. On hot afternoons, another player joins the mix — ozone (O₃) — not the protective kind high in the sky, but a gas formed when sunlight reacts with fumes from cars and factories. And weaving through it all are gases like nitrogen dioxide (NO₂), sulfur dioxide (SO₂), and carbon monoxide (CO), each born from the exhaust of traffic, power plants, and burning fuel. Each pollutant tells its own story, with limits beyond which it begins to harm our health. The Air Quality Index (AQI) acts like a translator — taking raw data, like “PM2.5 = 35 μg/m³,” and turning it into a simple message the public can grasp: how safe — or dangerous — today’s air really is.
As the story of the air continues, the science behind the AQI unfolds like a quiet detective tale — one that turns invisible pollution into a single, telling number.
Each day, air quality monitors scattered across the city measure concentrations of key pollutants — PM2.5, PM10, ozone, nitrogen dioxide, sulfur dioxide, and carbon monoxide. These raw numbers, often in micrograms per cubic meter, don’t mean much on their own. So, scientists take the next step: they convert each pollutant’s concentration into a “sub-index,” a score on a standard 0–500 scale that reflects its relative health impact. But here’s the twist — only the highest sub-index becomes the AQI. That single number represents the worst of what’s in the air at that moment. Take PM2.5, for example. Suppose the monitor shows 75 μg/m³ — high enough to fall in the “Unhealthy” bracket. Through a simple formula, that concentration translates to an AQI of around 161 — bright red on the chart. What does it mean? The air is dangerous for sensitive groups, and even healthy people should think twice before jogging outside. The easy takeaway: slow down, stay indoors if possible, and protect your lungs.
Why AQI Matters
A high AQI isn’t just a number — it’s a signal your body can feel. Short-term spikes lasting a few hours or days can lead to coughing, sore throats, asthma attacks, chest tightness, and headaches. Over the long term, chronic exposure increases the risks of heart and lung disease. The AQI gives you a real-time health forecast — not for rain or sun, but for the very air you breathe.
💡 Smart Ways to Use AQI Every Day
- Plan your day: If ozone is high, take that morning walk early before the sun intensifies. In winter smog, midday might be your best bet.
- Reroute or reschedule: Skip traffic-heavy routes and move workouts indoors when the AQI crosses 151.
- Mask up wisely: A snug N95 or FFP2 mask can help cut down particle exposure.
- Protect vulnerable groups: Kids, seniors, and people with heart or lung conditions should pay close attention to AQI alerts and category guidance.
⚖️ Read AQI Wisely
Like any tool, AQI has its limits. Local hotspots — near busy roads or construction sites — may not show up in citywide averages. Some systems rely on short “nowcast” windows, while others use longer averages, which can smooth out sudden changes. And across the world, while the idea is the same, different countries use slightly different scales, so an AQI of 101 in one place might not mean exactly the same elsewhere. Still, the AQI remains your daily compass for breathing safer, helping you make small choices that protect your health — one breath, one number, one day at a time.
Bridge to Solutions
Policy fixes (clean fuels, transit, industrial controls, ag alternatives to stubble burning) are non-negotiable. But cities also need near-term risk reduction: cleaner indoor air, hyper-local capture/filtration around high-exposure sites (schools, clinics, transit hubs), and real-time public info so people can adjust behavior. That’s where carbon-capture and air-cleaning systems—including biologically based approaches—can complement long-term emissions cuts by creating clean-air zones people can actually use during peak smog days.
(We’ll showcase how our systems fit into that stack in the next post.)